LIST OF TABLE
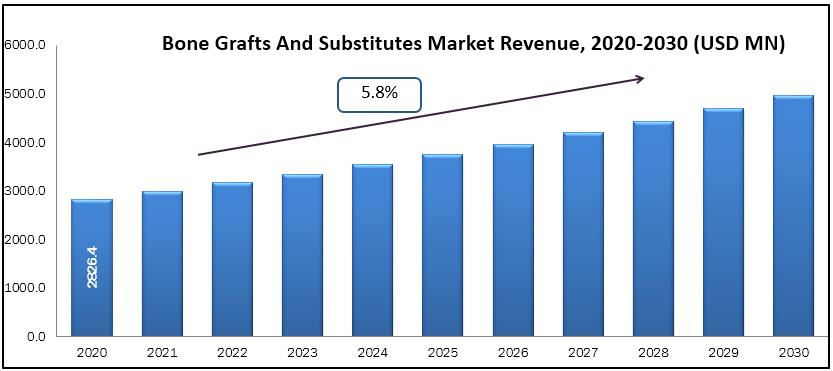
TABLE 1. Global Bone Grafts and Substitute Market Value, By Type, 2020-2030, Million USD
TABLE 2. Global Type Market Value, By Allograft, 2020-2030, Million USD
TABLE 3. Type - Allograft Market Value, By Region, Million USD
TABLE 4. Type - North America Allograft Market Value, By Country, Million USD
TABLE 5. Type - Europe Allograft Market Value, By Country, Million USD
TABLE 6. Type - Asia-Pacific Allograft Market Value, By Country, Million USD
TABLE 7. Type - Rest of World Allograft Market Value, By Country, Million USD
TABLE 8. Global Type Market Value, By Bone Graft Substitutes, 2020-2030, Million USD
TABLE 9. Type - Bone Graft Substitutes Market Value, By Region, Million USD
TABLE 10. Type - North America Bone Graft Substitutes Market Value, By Country, Million USD
TABLE 11. Type - Europe Bone Graft Substitutes Market Value, By Country, Million USD
TABLE 12. Type - Asia-Pacific Bone Graft Substitutes Market Value, By Country, Million USD
TABLE 13. Type - Rest of World Bone Graft Substitutes Market Value, By Country, Million USD
TABLE 14. Type - Cell based Matrices Market Value, By Region, Million USD
TABLE 15. Type - North America Cell based Matrices Market Value, By Country, Million USD
TABLE 16. Type - Europe Cell based Matrices Market Value, By Country, Million USD
TABLE 17. Type - Asia-Pacific Cell based Matrices Market Value, By Country, Million USD
TABLE 18. Type - Rest of World Cell based Matrices Market Value, By Country, Million USD
TABLE 19. Global Bone Grafts and Substitute Market Value, By Application, 2020-2030, Million USD
TABLE 20. Application - Spinal Fusion Market Value, By Region, Million USD
TABLE 21. Application - North America Spinal Fusion Market Value, By Country, Million USD
TABLE 22. Application - Europe Spinal Fusion Market Value, By Country, Million USD
TABLE 23. Application - Asia-Pacific Spinal Fusion Market Value, By Country, Million USD
TABLE 24. Application - Rest of World Spinal Fusion Market Value, By Country, Million USD
TABLE 25. Application - Trauma Market Value, By Region, Million USD
TABLE 26. Application - North America Trauma Market Value, By Country, Million USD
TABLE 27. Application - Europe Trauma Market Value, By Country, Million USD
TABLE 28. Application - Asia-Pacific Trauma Market Value, By Country, Million USD
TABLE 29. Application - Rest of World Trauma Market Value, By Country, Million USD
TABLE 30. Application - Joint Reconstruction Market Value, By Region, Million USD
TABLE 31. Application - North America Joint Reconstruction Market Value, By Country, Million USD
TABLE 32. Application - Europe Joint Reconstruction Market Value, By Country, Million USD
TABLE 33. Application - Asia-Pacific Joint Reconstruction Market Value, By Country, Million USD
TABLE 34. Application - Rest of World Joint Reconstruction Market Value, By Country, Million USD
TABLE 35. Application - Dental Bone grafting Market Value, By Region, Million USD
TABLE 36. Application - North America Dental Bone grafting Market Value, By Country, Million USD
TABLE 37. Application - Europe Dental Bone grafting Market Value, By Country, Million USD
TABLE 38. Application - Asia-Pacific Dental Bone grafting Market Value, By Country, Million USD
TABLE 39. Application - Rest of World Dental Bone grafting Market Value, By Country, Million USD
TABLE 40. Application - Craniomaxilofacial Market Value, By Region, Million USD
TABLE 41. Application - North America Craniomaxilofacial Market Value, By Country, Million USD
TABLE 42. Application - Europe Craniomaxilofacial Market Value, By Country, Million USD
TABLE 43. Application - Asia-Pacific Craniomaxilofacial Market Value, By Country, Million USD
TABLE 44. Application - Rest of World Craniomaxilofacial Market Value, By Country, Million USD
TABLE 45. Global Bone Grafts and Substitute Market Value, By Region, 2020-2030, Million USD
TABLE 46. North America Bone Grafts and Substitute Market Value, By Type, 2020-2030, Million USD
TABLE 47. North America Type Market Value, By Allograft, 2020-2030, Million USD
TABLE 48. North America Type Market Value, By Bone Graft Substitutes, 2020-2030, Million USD
TABLE 49. North America Bone Grafts and Substitute Market Value, By Application, 2020-2030, Million USD
TABLE 50. North America Bone Grafts and Substitute Market Value, By Country, 2020-2030, Million USD
TABLE 51. U.S. Bone Grafts and Substitute Market Value, By Type, 2020-2030, Million USD
TABLE 52. U.S. Type Market Value, By Allograft, 2020-2030, Million USD
TABLE 53. U.S. Type Market Value, By Bone Graft Substitutes, 2020-2030, Million USD
TABLE 54. U.S. Bone Grafts and Substitute Market Value, By Application, 2020-2030, Million USD
TABLE 55. Canada Bone Grafts and Substitute Market Value, By Type, 2020-2030, Million USD
TABLE 56. Canada Type Market Value, By Allograft, 2020-2030, Million USD
TABLE 57. Canada Type Market Value, By Bone Graft Substitutes, 2020-2030, Million USD
TABLE 58. Canada Bone Grafts and Substitute Market Value, By Application, 2020-2030, Million USD
TABLE 59. Mexico Bone Grafts and Substitute Market Value, By Type, 2020-2030, Million USD
TABLE 60. Mexico Type Market Value, By Allograft, 2020-2030, Million USD
TABLE 61. Mexico Type Market Value, By Bone Graft Substitutes, 2020-2030, Million USD
TABLE 62. Mexico Bone Grafts and Substitute Market Value, By Application, 2020-2030, Million USD
TABLE 63. Europe Bone Grafts and Substitute Market Value, By Type, 2020-2030, Million USD
TABLE 64. Europe Type Market Value, By Allograft, 2020-2030, Million USD
TABLE 65. Europe Type Market Value, By Bone Graft Substitutes, 2020-2030, Million USD
TABLE 66. Europe Bone Grafts and Substitute Market Value, By Application, 2020-2030, Million USD
TABLE 67. Europe Bone Grafts and Substitute Market Value, By Country, 2020-2030, Million USD
TABLE 68. France Bone Grafts and Substitute Market Value, By Type, 2020-2030, Million USD
TABLE 69. France Type Market Value, By Allograft, 2020-2030, Million USD
TABLE 70. France Type Market Value, By Bone Graft Substitutes, 2020-2030, Million USD
TABLE 71. France Bone Grafts and Substitute Market Value, By Application, 2020-2030, Million USD
TABLE 72. Germany Bone Grafts and Substitute Market Value, By Type, 2020-2030, Million USD
TABLE 73. Germany Type Market Value, By Allograft, 2020-2030, Million USD
TABLE 74. Germany Type Market Value, By Bone Graft Substitutes, 2020-2030, Million USD
TABLE 75. Germany Bone Grafts and Substitute Market Value, By Application, 2020-2030, Million USD
TABLE 76. U.K. Bone Grafts and Substitute Market Value, By Type, 2020-2030, Million USD
TABLE 77. U.K. Type Market Value, By Allograft, 2020-2030, Million USD
TABLE 78. U.K. Type Market Value, By Bone Graft Substitutes, 2020-2030, Million USD
TABLE 79. U.K. Bone Grafts and Substitute Market Value, By Application, 2020-2030, Million USD
TABLE 80. Spain Bone Grafts and Substitute Market Value, By Type, 2020-2030, Million USD
TABLE 81. Spain Type Market Value, By Allograft, 2020-2030, Million USD
TABLE 82. Spain Type Market Value, By Bone Graft Substitutes, 2020-2030, Million USD
TABLE 83. Spain Bone Grafts and Substitute Market Value, By Application, 2020-2030, Million USD
TABLE 84. Italy Bone Grafts and Substitute Market Value, By Type, 2020-2030, Million USD
TABLE 85. Italy Type Market Value, By Allograft, 2020-2030, Million USD
TABLE 86. Italy Type Market Value, By Bone Graft Substitutes, 2020-2030, Million USD
TABLE 87. Italy Bone Grafts and Substitute Market Value, By Application, 2020-2030, Million USD
TABLE 88. Rest of Europe Bone Grafts and Substitute Market Value, By Type, 2020-2030, Million USD
TABLE 89. Rest of Europe Type Market Value, By Allograft, 2020-2030, Million USD
TABLE 90. Rest of Europe Type Market Value, By Bone Graft Substitutes, 2020-2030, Million USD
TABLE 91. Rest of Europe Bone Grafts and Substitute Market Value, By Application, 2020-2030, Million USD
TABLE 92. Asia-Pacific Bone Grafts and Substitute Market Value, By Type, 2020-2030, Million USD
TABLE 93. Asia-Pacific Type Market Value, By Allograft, 2020-2030, Million USD
TABLE 94. Asia-Pacific Type Market Value, By Bone Graft Substitutes, 2020-2030, Million USD
TABLE 95. Asia-Pacific Bone Grafts and Substitute Market Value, By Application, 2020-2030, Million USD
TABLE 96. Asia-Pacific Bone Grafts and Substitute Market Value, By Country, 2020-2030, Million USD
TABLE 97. India Bone Grafts and Substitute Market Value, By Type, 2020-2030, Million USD
TABLE 98. India Type Market Value, By Allograft, 2020-2030, Million USD
TABLE 99. India Type Market Value, By Bone Graft Substitutes, 2020-2030, Million USD
TABLE 100. India Bone Grafts and Substitute Market Value, By Application, 2020-2030, Million USD
TABLE 101. China Bone Grafts and Substitute Market Value, By Type, 2020-2030, Million USD
TABLE 102. China Type Market Value, By Allograft, 2020-2030, Million USD
TABLE 103. China Type Market Value, By Bone Graft Substitutes, 2020-2030, Million USD
TABLE 104. China Bone Grafts and Substitute Market Value, By Application, 2020-2030, Million USD
TABLE 105. Japan Bone Grafts and Substitute Market Value, By Type, 2020-2030, Million USD
TABLE 106. Japan Type Market Value, By Allograft, 2020-2030, Million USD
TABLE 107. Japan Type Market Value, By Bone Graft Substitutes, 2020-2030, Million USD
TABLE 108. Japan Bone Grafts and Substitute Market Value, By Application, 2020-2030, Million USD
TABLE 109. Korea Bone Grafts and Substitute Market Value, By Type, 2020-2030, Million USD
TABLE 110. Korea Type Market Value, By Allograft, 2020-2030, Million USD
TABLE 111. Korea Type Market Value, By Bone Graft Substitutes, 2020-2030, Million USD
TABLE 112. Korea Bone Grafts and Substitute Market Value, By Application, 2020-2030, Million USD
TABLE 113. Australia Bone Grafts and Substitute Market Value, By Type, 2020-2030, Million USD
TABLE 114. Australia Type Market Value, By Allograft, 2020-2030, Million USD
TABLE 115. Australia Type Market Value, By Bone Graft Substitutes, 2020-2030, Million USD
TABLE 116. Australia Bone Grafts and Substitute Market Value, By Application, 2020-2030, Million USD
TABLE 117. Rest of Asia Pacific Bone Grafts and Substitute Market Value, By Type, 2020-2030, Million USD
TABLE 118. Rest of Asia Pacific Type Market Value, By Allograft, 2020-2030, Million USD
TABLE 119. Rest of Asia Pacific Type Market Value, By Bone Graft Substitutes, 2020-2030, Million USD
TABLE 120. Rest of Asia Pacific Bone Grafts and Substitute Market Value, By Application, 2020-2030, Million USD
TABLE 121. Rest of World Bone Grafts and Substitute Market Value, By Type, 2020-2030, Million USD
TABLE 122. Rest of World Type Market Value, By Allograft, 2020-2030, Million USD
TABLE 123. Rest of World Type Market Value, By Bone Graft Substitutes, 2020-2030, Million USD
TABLE 124. Rest of World Bone Grafts and Substitute Market Value, By Application, 2020-2030, Million USD
TABLE 125. Rest of World Bone Grafts and Substitute Market Value, By Country, 2020-2030, Million USD
TABLE 126. Brazil Bone Grafts and Substitute Market Value, By Type, 2020-2030, Million USD
TABLE 127. Brazil Type Market Value, By Allograft, 2020-2030, Million USD
TABLE 128. Brazil Type Market Value, By Bone Graft Substitutes, 2020-2030, Million USD
TABLE 129. Brazil Bone Grafts and Substitute Market Value, By Application, 2020-2030, Million USD
TABLE 130. Israel Bone Grafts and Substitute Market Value, By Type, 2020-2030, Million USD
TABLE 131. Israel Type Market Value, By Allograft, 2020-2030, Million USD
TABLE 132. Israel Type Market Value, By Bone Graft Substitutes, 2020-2030, Million USD
TABLE 133. Israel Bone Grafts and Substitute Market Value, By Application, 2020-2030, Million USD
TABLE 134. Saudi Arabia Bone Grafts and Substitute Market Value, By Type, 2020-2030, Million USD
TABLE 135. Saudi Arabia Type Market Value, By Allograft, 2020-2030, Million USD
TABLE 136. Saudi Arabia Type Market Value, By Bone Graft Substitutes, 2020-2030, Million USD
TABLE 137. Saudi Arabia Bone Grafts and Substitute Market Value, By Application, 2020-2030, Million USD
TABLE 138. South Africa Bone Grafts and Substitute Market Value, By Type, 2020-2030, Million USD
TABLE 139. South Africa Type Market Value, By Allograft, 2020-2030, Million USD
TABLE 140. South Africa Type Market Value, By Bone Graft Substitutes, 2020-2030, Million USD
TABLE 141. South Africa Bone Grafts and Substitute Market Value, By Application, 2020-2030, Million USD
TABLE 142. Rest of LAMEA Bone Grafts and Substitute Market Value, By Type, 2020-2030, Million USD
TABLE 143. Rest of LAMEA Type Market Value, By Allograft, 2020-2030, Million USD
TABLE 144. Rest of LAMEA Type Market Value, By Bone Graft Substitutes, 2020-2030, Million USD
TABLE 145. Rest of LAMEA Bone Grafts and Substitute Market Value, By Application, 2020-2030, Million USD
LIST OF FIGURES
FIGURE 1. Global Bone Grafts and Substitute Market Value, By Type, 2020-2030, Million USD
FIGURE 2. Global Type Market Value, By Allograft, 2020-2030, Million USD
FIGURE 3. Type - Allograft Market Value, By Region, Million USD
FIGURE 4. Type - North America Allograft Market Value, By Country, Million USD
FIGURE 5. Type - Europe Allograft Market Value, By Country, Million USD
FIGURE 6. Type - Asia-Pacific Allograft Market Value, By Country, Million USD
FIGURE 7. Type - Rest of World Allograft Market Value, By Country, Million USD
FIGURE 8. Global Type Market Value, By Bone Graft Substitutes, 2020-2030, Million USD
FIGURE 9. Type - Bone Graft Substitutes Market Value, By Region, Million USD
FIGURE 10. Type - North America Bone Graft Substitutes Market Value, By Country, Million USD
FIGURE 11. Type - Europe Bone Graft Substitutes Market Value, By Country, Million USD
FIGURE 12. Type - Asia-Pacific Bone Graft Substitutes Market Value, By Country, Million USD
FIGURE 13. Type - Rest of World Bone Graft Substitutes Market Value, By Country, Million USD
FIGURE 14. Type - Cell based Matrices Market Value, By Region, Million USD
FIGURE 15. Type - North America Cell based Matrices Market Value, By Country, Million USD
FIGURE 16. Type - Europe Cell based Matrices Market Value, By Country, Million USD
FIGURE 17. Type - Asia-Pacific Cell based Matrices Market Value, By Country, Million USD
FIGURE 18. Type - Rest of World Cell based Matrices Market Value, By Country, Million USD
FIGURE 19. Global Bone Grafts and Substitute Market Value, By Application, 2020-2030, Million USD
FIGURE 20. Application - Spinal Fusion Market Value, By Region, Million USD
FIGURE 21. Application - North America Spinal Fusion Market Value, By Country, Million USD
FIGURE 22. Application - Europe Spinal Fusion Market Value, By Country, Million USD
FIGURE 23. Application - Asia-Pacific Spinal Fusion Market Value, By Country, Million USD
FIGURE 24. Application - Rest of World Spinal Fusion Market Value, By Country, Million USD
FIGURE 25. Application - Trauma Market Value, By Region, Million USD
FIGURE 26. Application - North America Trauma Market Value, By Country, Million USD
FIGURE 27. Application - Europe Trauma Market Value, By Country, Million USD
FIGURE 28. Application - Asia-Pacific Trauma Market Value, By Country, Million USD
FIGURE 29. Application - Rest of World Trauma Market Value, By Country, Million USD
FIGURE 30. Application - Joint Reconstruction Market Value, By Region, Million USD
FIGURE 31. Application - North America Joint Reconstruction Market Value, By Country, Million USD
FIGURE 32. Application - Europe Joint Reconstruction Market Value, By Country, Million USD
FIGURE 33. Application - Asia-Pacific Joint Reconstruction Market Value, By Country, Million USD
FIGURE 34. Application - Rest of World Joint Reconstruction Market Value, By Country, Million USD
FIGURE 35. Application - Dental Bone grafting Market Value, By Region, Million USD
FIGURE 36. Application - North America Dental Bone grafting Market Value, By Country, Million USD
FIGURE 37. Application - Europe Dental Bone grafting Market Value, By Country, Million USD
FIGURE 38. Application - Asia-Pacific Dental Bone grafting Market Value, By Country, Million USD
FIGURE 39. Application - Rest of World Dental Bone grafting Market Value, By Country, Million USD
FIGURE 40. Application - Craniomaxilofacial Market Value, By Region, Million USD
FIGURE 41. Application - North America Craniomaxilofacial Market Value, By Country, Million USD
FIGURE 42. Application - Europe Craniomaxilofacial Market Value, By Country, Million USD
FIGURE 43. Application - Asia-Pacific Craniomaxilofacial Market Value, By Country, Million USD
FIGURE 44. Application - Rest of World Craniomaxilofacial Market Value, By Country, Million USD
FIGURE 45. Global Bone Grafts and Substitute Market Value, By Region, 2020-2030, Million USD
FIGURE 46. North America Bone Grafts and Substitute Market Value, By Type, 2020-2030, Million USD
FIGURE 47. North America Type Market Value, By Allograft, 2020-2030, Million USD
FIGURE 48. North America Type Market Value, By Bone Graft Substitutes, 2020-2030, Million USD
FIGURE 49. North America Bone Grafts and Substitute Market Value, By Application, 2020-2030, Million USD
FIGURE 50. North America Bone Grafts and Substitute Market Value, By Country, 2020-2030, Million USD
FIGURE 51. U.S. Bone Grafts and Substitute Market Value, By Type, 2020-2030, Million USD
FIGURE 52. U.S. Type Market Value, By Allograft, 2020-2030, Million USD
FIGURE 53. U.S. Type Market Value, By Bone Graft Substitutes, 2020-2030, Million USD
FIGURE 54. U.S. Bone Grafts and Substitute Market Value, By Application, 2020-2030, Million USD
FIGURE 55. Canada Bone Grafts and Substitute Market Value, By Type, 2020-2030, Million USD
FIGURE 56. Canada Type Market Value, By Allograft, 2020-2030, Million USD
FIGURE 57. Canada Type Market Value, By Bone Graft Substitutes, 2020-2030, Million USD
FIGURE 58. Canada Bone Grafts and Substitute Market Value, By Application, 2020-2030, Million USD
FIGURE 59. Mexico Bone Grafts and Substitute Market Value, By Type, 2020-2030, Million USD
FIGURE 60. Mexico Type Market Value, By Allograft, 2020-2030, Million USD
FIGURE 61. Mexico Type Market Value, By Bone Graft Substitutes, 2020-2030, Million USD
FIGURE 62. Mexico Bone Grafts and Substitute Market Value, By Application, 2020-2030, Million USD
FIGURE 63. Europe Bone Grafts and Substitute Market Value, By Type, 2020-2030, Million USD
FIGURE 64. Europe Type Market Value, By Allograft, 2020-2030, Million USD
FIGURE 65. Europe Type Market Value, By Bone Graft Substitutes, 2020-2030, Million USD
FIGURE 66. Europe Bone Grafts and Substitute Market Value, By Application, 2020-2030, Million USD
FIGURE 67. Europe Bone Grafts and Substitute Market Value, By Country, 2020-2030, Million USD
FIGURE 68. France Bone Grafts and Substitute Market Value, By Type, 2020-2030, Million USD
FIGURE 69. France Type Market Value, By Allograft, 2020-2030, Million USD
FIGURE 70. France Type Market Value, By Bone Graft Substitutes, 2020-2030, Million USD
FIGURE 71. France Bone Grafts and Substitute Market Value, By Application, 2020-2030, Million USD
FIGURE 72. Germany Bone Grafts and Substitute Market Value, By Type, 2020-2030, Million USD
FIGURE 73. Germany Type Market Value, By Allograft, 2020-2030, Million USD
FIGURE 74. Germany Type Market Value, By Bone Graft Substitutes, 2020-2030, Million USD
FIGURE 75. Germany Bone Grafts and Substitute Market Value, By Application, 2020-2030, Million USD
FIGURE 76. U.K. Bone Grafts and Substitute Market Value, By Type, 2020-2030, Million USD
FIGURE 77. U.K. Type Market Value, By Allograft, 2020-2030, Million USD
FIGURE 78. U.K. Type Market Value, By Bone Graft Substitutes, 2020-2030, Million USD
FIGURE 79. U.K. Bone Grafts and Substitute Market Value, By Application, 2020-2030, Million USD
FIGURE 80. Spain Bone Grafts and Substitute Market Value, By Type, 2020-2030, Million USD
FIGURE 81. Spain Type Market Value, By Allograft, 2020-2030, Million USD
FIGURE 82. Spain Type Market Value, By Bone Graft Substitutes, 2020-2030, Million USD
FIGURE 83. Spain Bone Grafts and Substitute Market Value, By Application, 2020-2030, Million USD
FIGURE 84. Italy Bone Grafts and Substitute Market Value, By Type, 2020-2030, Million USD
FIGURE 85. Italy Type Market Value, By Allograft, 2020-2030, Million USD
FIGURE 86. Italy Type Market Value, By Bone Graft Substitutes, 2020-2030, Million USD
FIGURE 87. Italy Bone Grafts and Substitute Market Value, By Application, 2020-2030, Million USD
FIGURE 88. Rest of Europe Bone Grafts and Substitute Market Value, By Type, 2020-2030, Million USD
FIGURE 89. Rest of Europe Type Market Value, By Allograft, 2020-2030, Million USD
FIGURE 90. Rest of Europe Type Market Value, By Bone Graft Substitutes, 2020-2030, Million USD
FIGURE 91. Rest of Europe Bone Grafts and Substitute Market Value, By Application, 2020-2030, Million USD
FIGURE 92. Asia-Pacific Bone Grafts and Substitute Market Value, By Type, 2020-2030, Million USD
FIGURE 93. Asia-Pacific Type Market Value, By Allograft, 2020-2030, Million USD
FIGURE 94. Asia-Pacific Type Market Value, By Bone Graft Substitutes, 2020-2030, Million USD
FIGURE 95. Asia-Pacific Bone Grafts and Substitute Market Value, By Application, 2020-2030, Million USD
FIGURE 96. Asia-Pacific Bone Grafts and Substitute Market Value, By Country, 2020-2030, Million USD
FIGURE 97. India Bone Grafts and Substitute Market Value, By Type, 2020-2030, Million USD
FIGURE 98. India Type Market Value, By Allograft, 2020-2030, Million USD
FIGURE 99. India Type Market Value, By Bone Graft Substitutes, 2020-2030, Million USD
FIGURE 100. India Bone Grafts and Substitute Market Value, By Application, 2020-2030, Million USD
FIGURE 101. China Bone Grafts and Substitute Market Value, By Type, 2020-2030, Million USD
FIGURE 102. China Type Market Value, By Allograft, 2020-2030, Million USD
FIGURE 103. China Type Market Value, By Bone Graft Substitutes, 2020-2030, Million USD
FIGURE 104. China Bone Grafts and Substitute Market Value, By Application, 2020-2030, Million USD
FIGURE 105. Japan Bone Grafts and Substitute Market Value, By Type, 2020-2030, Million USD
FIGURE 106. Japan Type Market Value, By Allograft, 2020-2030, Million USD
FIGURE 107. Japan Type Market Value, By Bone Graft Substitutes, 2020-2030, Million USD
FIGURE 108. Japan Bone Grafts and Substitute Market Value, By Application, 2020-2030, Million USD
FIGURE 109. Korea Bone Grafts and Substitute Market Value, By Type, 2020-2030, Million USD
FIGURE 110. Korea Type Market Value, By Allograft, 2020-2030, Million USD
FIGURE 111. Korea Type Market Value, By Bone Graft Substitutes, 2020-2030, Million USD
FIGURE 112. Korea Bone Grafts and Substitute Market Value, By Application, 2020-2030, Million USD
FIGURE 113. Australia Bone Grafts and Substitute Market Value, By Type, 2020-2030, Million USD
FIGURE 114. Australia Type Market Value, By Allograft, 2020-2030, Million USD
FIGURE 115. Australia Type Market Value, By Bone Graft Substitutes, 2020-2030, Million USD
FIGURE 116. Australia Bone Grafts and Substitute Market Value, By Application, 2020-2030, Million USD
FIGURE 117. Rest of Asia Pacific Bone Grafts and Substitute Market Value, By Type, 2020-2030, Million USD
FIGURE 118. Rest of Asia Pacific Type Market Value, By Allograft, 2020-2030, Million USD
FIGURE 119. Rest of Asia Pacific Type Market Value, By Bone Graft Substitutes, 2020-2030, Million USD
FIGURE 120. Rest of Asia Pacific Bone Grafts and Substitute Market Value, By Application, 2020-2030, Million USD
FIGURE 121. Rest of World Bone Grafts and Substitute Market Value, By Type, 2020-2030, Million USD
FIGURE 122. Rest of World Type Market Value, By Allograft, 2020-2030, Million USD
FIGURE 123. Rest of World Type Market Value, By Bone Graft Substitutes, 2020-2030, Million USD
FIGURE 124. Rest of World Bone Grafts and Substitute Market Value, By Application, 2020-2030, Million USD
FIGURE 125. Rest of World Bone Grafts and Substitute Market Value, By Country, 2020-2030, Million USD
FIGURE 126. Brazil Bone Grafts and Substitute Market Value, By Type, 2020-2030, Million USD
FIGURE 127. Brazil Type Market Value, By Allograft, 2020-2030, Million USD
FIGURE 128. Brazil Type Market Value, By Bone Graft Substitutes, 2020-2030, Million USD
FIGURE 129. Brazil Bone Grafts and Substitute Market Value, By Application, 2020-2030, Million USD
FIGURE 130. Israel Bone Grafts and Substitute Market Value, By Type, 2020-2030, Million USD
FIGURE 131. Israel Type Market Value, By Allograft, 2020-2030, Million USD
FIGURE 132. Israel Type Market Value, By Bone Graft Substitutes, 2020-2030, Million USD
FIGURE 133. Israel Bone Grafts and Substitute Market Value, By Application, 2020-2030, Million USD
FIGURE 134. Saudi Arabia Bone Grafts and Substitute Market Value, By Type, 2020-2030, Million USD
FIGURE 135. Saudi Arabia Type Market Value, By Allograft, 2020-2030, Million USD
FIGURE 136. Saudi Arabia Type Market Value, By Bone Graft Substitutes, 2020-2030, Million USD
FIGURE 137. Saudi Arabia Bone Grafts and Substitute Market Value, By Application, 2020-2030, Million USD
FIGURE 138. South Africa Bone Grafts and Substitute Market Value, By Type, 2020-2030, Million USD
FIGURE 139. South Africa Type Market Value, By Allograft, 2020-2030, Million USD
FIGURE 140. South Africa Type Market Value, By Bone Graft Substitutes, 2020-2030, Million USD
FIGURE 141. South Africa Bone Grafts and Substitute Market Value, By Application, 2020-2030, Million USD
FIGURE 142. Rest of LAMEA Bone Grafts and Substitute Market Value, By Type, 2020-2030, Million USD
FIGURE 143. Rest of LAMEA Type Market Value, By Allograft, 2020-2030, Million USD
FIGURE 144. Rest of LAMEA Type Market Value, By Bone Graft Substitutes, 2020-2030, Million USD
FIGURE 145. Rest of LAMEA Bone Grafts and Substitute Market Value, By Application, 2020-2030, Million USD
FIGURE 146. BAXTER: NET SALES, 2016–2018 ($MILLION)
FIGURE 147. J&J: Revenue, 2016–2018 ($MILLION)


